Click here to download doc for design.
 Greenhouse gas concentrations in the atmosphere will continue to increase unless the billions of tons of our annual emissions decrease substantially. Increased concentrations are expected to:
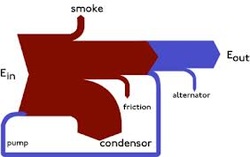 Key words: sankey diagram, energy flow What is energy flow diagram? Energy flow diagram also known as Sankey diagram is a specific type of flow diagram in which the width of the arrows is proportional to the quantity of energy. Length of arrows has no bearings with the quantity of energy. These diagrams indicate the flow of energy in a process and help identifying the quality and quantity of energy. Quality of energy is indicated by the temperatures of inputs and outputs of energy. The input of energy begins from the left of the diagram. The outputs of energy are shown on the right side of the diagram as illustrated in the above figure. Do the exercises below for Monday: 1. Paula transfers 40 000J of chemical energy during a race. She transfers 32 000J of heat energy to the surroundings during the race. Calculate her efficiency and draw a Sankey diagram to scale. 2. Jeremy dreams of a Ferrari Enzo which can develop a maximum of 700 bhp. (1 bhp = 750 Watts). Sadly for Jeremy petrol cars are not very efficient. Typically, only about 30% of the energy that is available from the combustion of the petrol actually ends up overcoming friction to move the car forwards. Of the 70% of energy is that is not usefully converted, 55% may heat the cooling water that surrounds the engine block whilst 15% may be in the hot exhaust gases. To make car engines more efficient the fuel has to burn at a higher temperature and the exhaust must be kept cooler. Draw a Sankey diagram of Jeremy’s dinosaur. 3. What is the thermal output for the engine below and what is the efficiency e? 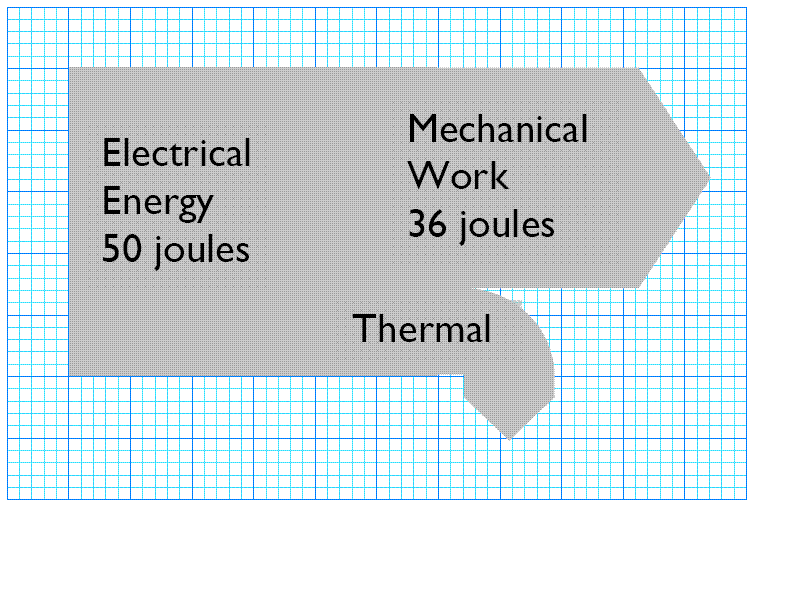
|
AuthorDr.Harris Stroumpos, M.Sc., Ph.D., ArchivesCategories |
 RSS Feed
